Other
ER diagrams
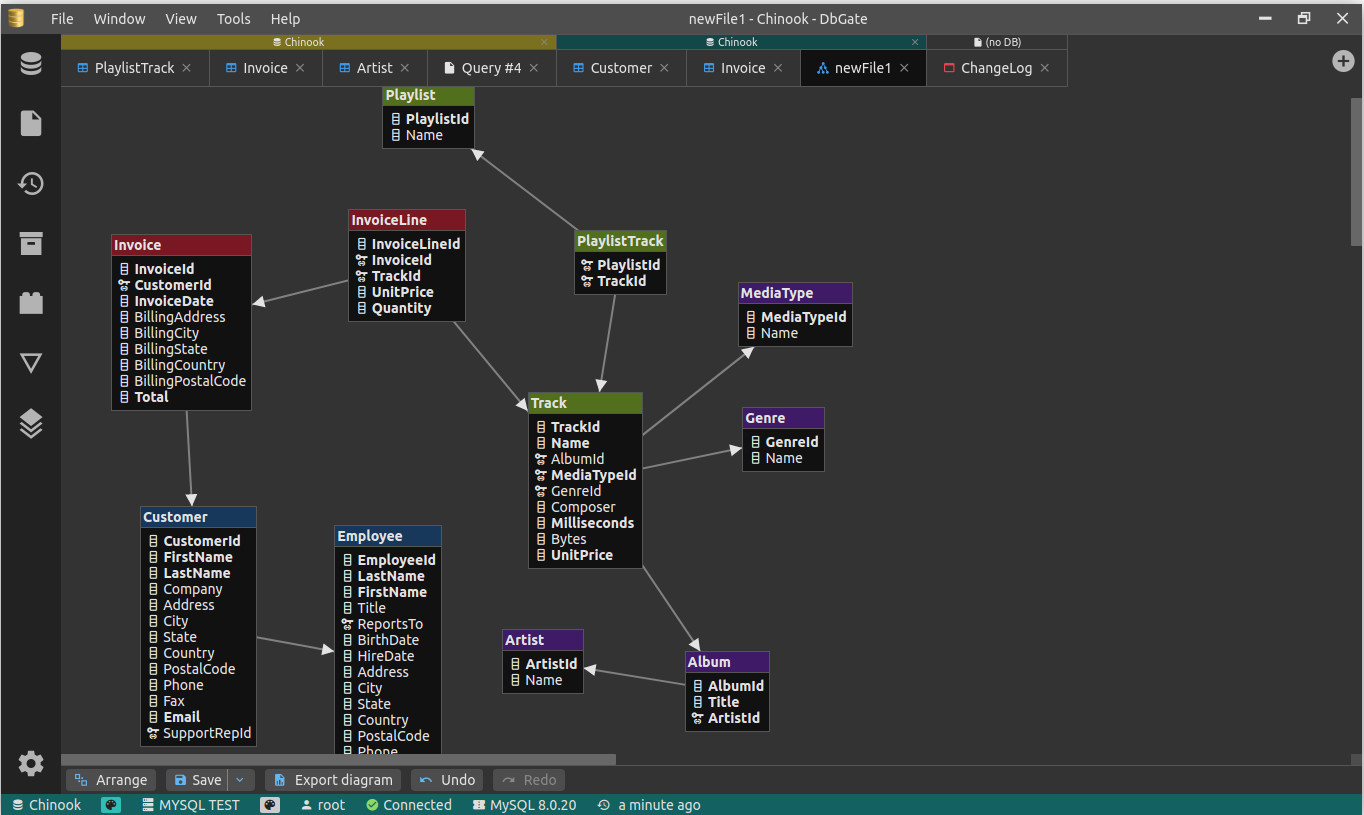
You can create ER diagram in database context menu (than all tables will be in diagram) or in table context menu (that tables related with selected table will be on diagram).
Diagrams supports some styling:
- Table colors
- Filter columns of tables (primary key, all keys, not null columns)
- Show column properties (data type, nullability)
You can export diagram to standalone HTML file.
Example of diagram export is here
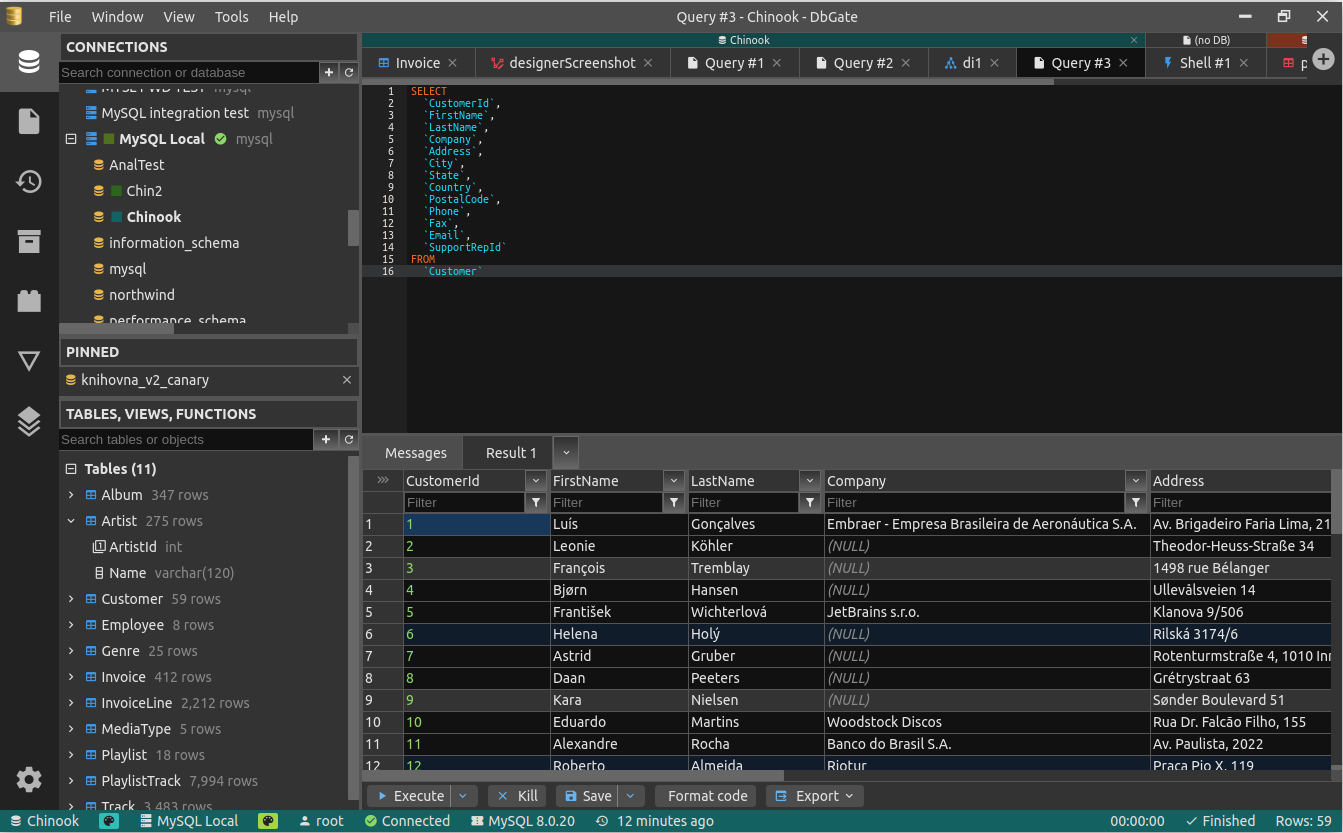
Saved files
- Save files to internal DbGate storage (or to disk, when you are not using web version)
- Saved file types:
- SQL queries
- Query designs
- JavaScript data scripts
- Markdown pages (handy for web version)
- Charts
Charts
- Visualise query result or any tabular data
- Supported chart types:
- Bar
- Line
- Pie
- Polar area
- Customize chart colors
Maps
- Visualise geographic data on map
- Supported map sources:
- MySQL: All spatial columns
- MSSQL: GEOGRAPHY columns
- PostGIS: GEOGRAPHY columns
- All data sources: coordinates stored in latitude/longitude columns
Other
- Archive folders - save your data locally. For this storage, JSON lines format is used (the same, as Mongo uses for collections backups)
- Mark favorite objects (tables, possibly with filters and master/detail views, queries, charts). Favorites are accesible from widgets or from toolbar.
- Recently closed tabs - if you close unsaved query, you find it in recently closed tabs for one week.
- Configurable keyboard shortcut
ER diagram

Charts
Dark mode

Command palette
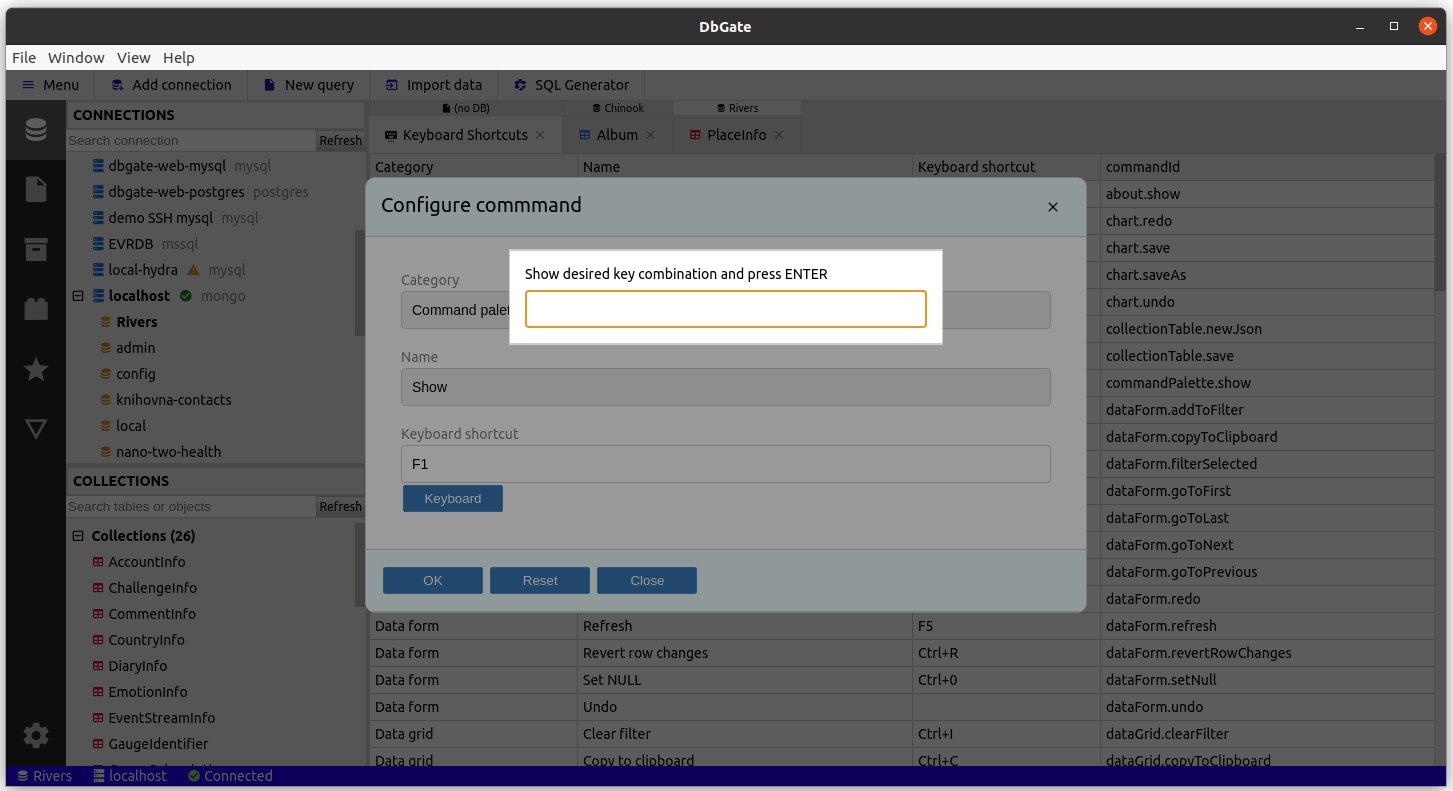
Configure keyboard shortcuts
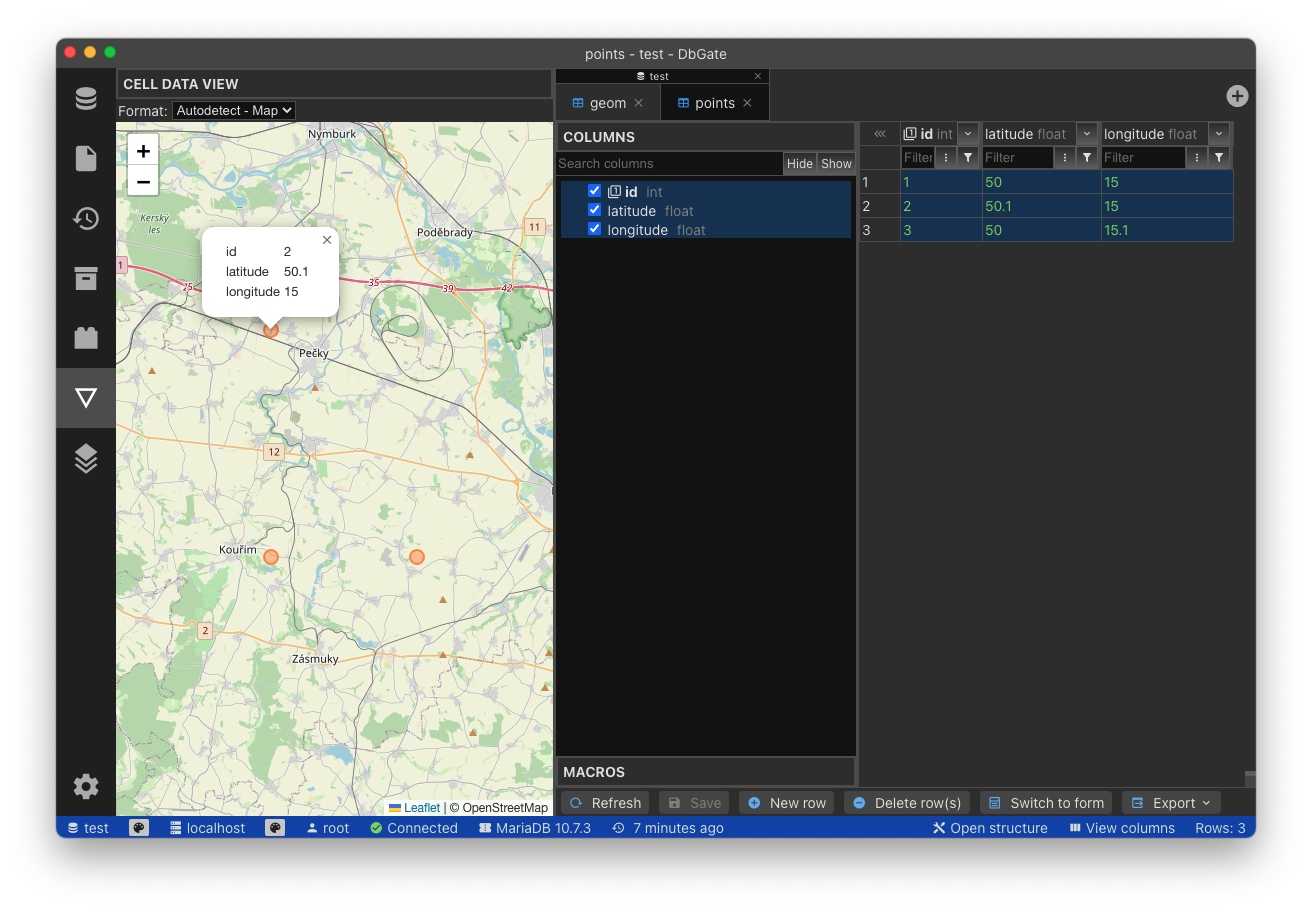
Show points on map